ESAI TASK 1
Task 1 IELTS – Sir Wara (Bumibahasa) – 1
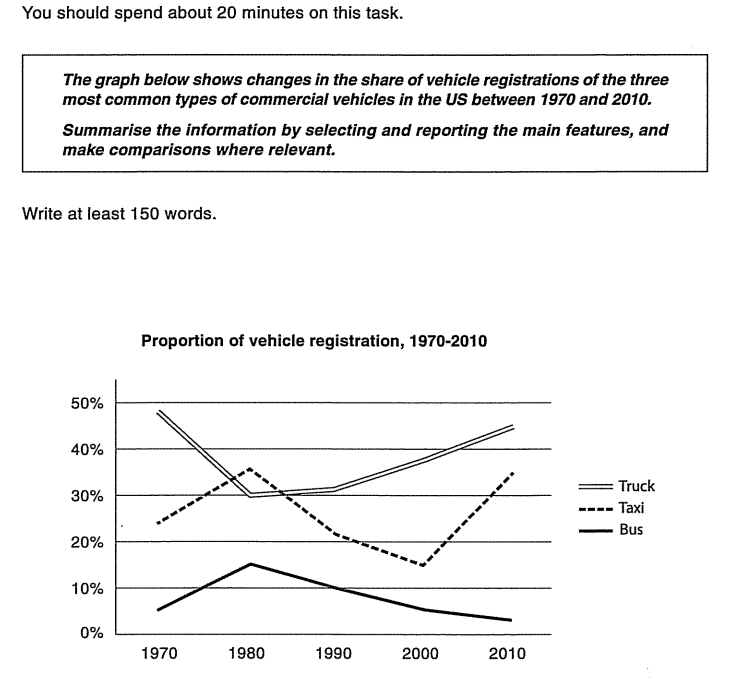
The graph depicts the changing patterns in commercial vehicle registrations across three categories – trucks, taxis, and buses…
March 17, 2026
Baca →
The graph depicts the changing patterns in commercial vehicle registrations across three categories – trucks, taxis, and buses…
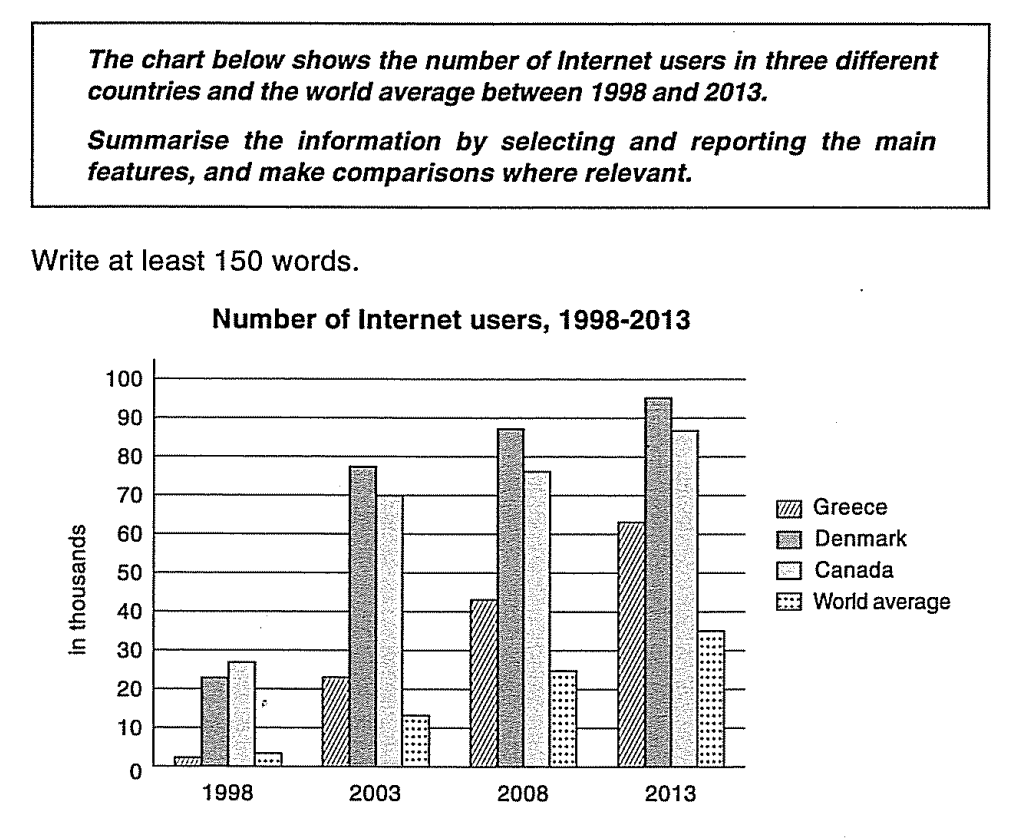
The graph illustrates Internet user statistics for Greece, Denmark, and Canada, alongside the global average, spanning from 1998…
The bar charts illustrate the proportions of people born in Australia and those born overseas who resided in…