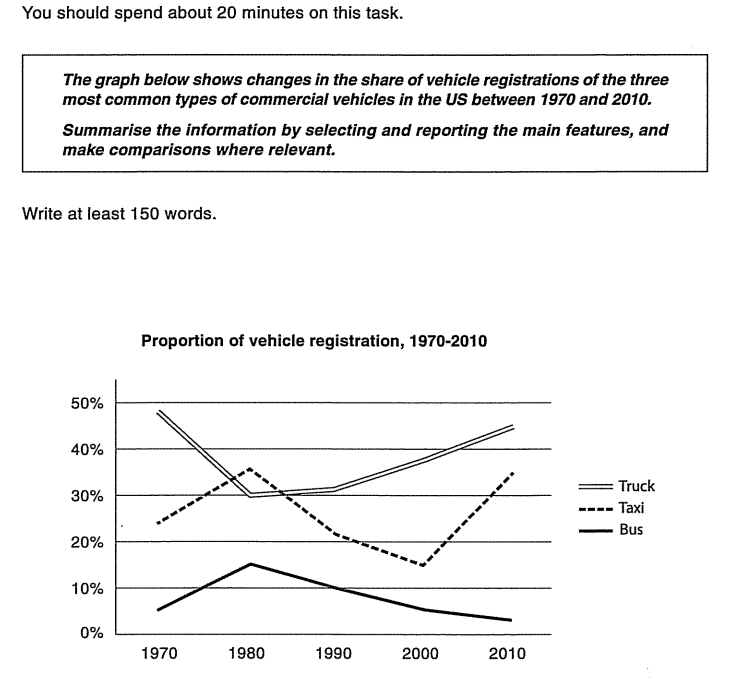
The graph depicts the changing patterns in commercial vehicle registrations across three categories – trucks, taxis, and buses – in the United States from 1970 to 2010. Over this forty-year period, significant shifts occurred in the transportation landscape.
In 1970, trucks dominated the commercial vehicle sector with approximately 45% of registrations, matched closely by taxis at around 25%, while buses held the smallest share at about 5%. The following decade saw interesting changes, with truck registrations declining to roughly 30% by 1980, while taxi registrations peaked at about 35% during the same period. Bus registrations showed a modest increase to approximately 15%.
The 1990s marked a turning point, particularly for trucks, which began a steady upward trend from 30% to eventually reclaim their dominant position at about 45% by 2010. In contrast, taxi registrations experienced a significant decline through the 1990s and early 2000s, dropping to their lowest point of approximately 15% in 2000, before rebounding sharply to around 35% by 2010. Bus registrations gradually declined from their peak in the 1980s, settling at just above 2% by 2010.
Overall, the most striking feature of this data is the inverse relationship between truck and taxi registrations, suggesting a possible correlation between these two sectors of commercial transportation. Additionally, the steady decline in bus registrations over the latter half of the period indicates a diminishing role for public transport in the commercial vehicle sector during these decades.